(317) 707-3700 info@banning-eng.com
  • Facebook
  • RSS
  • Facebook
  • RSS
Banning Engineering
  • Home
  • About & History
    • About & History
    • Meet Our Team
    • News
  • Testimonials
    • Clients
    • Team Members
  • Careers
    • Benefits
    • Job Opportunities
    • Online Application
  • Markets
    • Construction Services
    • GIS Services
      • GIS Utility Mapping
      • GIS for Roads
      • GIS for Economic Development
      • GIS for Public Awareness
      • GIS Support
      • GIS Additional Services
    • Economic Development
    • Private Utility Locating
    • Recreation and Quality of Life
    • Site Development
      • Site Development Commercial
      • Site Development Residential
    • Stormwater, Dams and Levees
    • Surveying
    • Transportation
    • Water & Wastewater
  • Civic Engagement
  • Contact
Select Page

Pendleton Town Hall Window Display

Apr 28, 2023 | Civic Engagement, Featured, Newsletter

We spent this winter/spring participating in the Pendleton Town Hall Window Display. The Pendleton Placemaking Advisory Team spearheaded a year-round Town Hall Window Display Program to showcase the spirit of the community. The Placemaking Advisory Team invited local organizations and businesses to apply to sponsor and decorate the two window bays of the Town Hall Council Chambers for the 2023 calendar year. We decided to partner with a local organization in our efforts to participate. After discussing with some of our friends at the Town Hall, we asked the Pendleton Historical Museum if they would be interested in partnering with us for the display. To our excitement, they agreed. We collaborated and determined that our joint display would show a then and now of Pendleton: images, plans, drawings, and items depicting the growth and change over the years. We wanted to blend the history of the Town with the work we’ve completed for the Town. Our goal, when working in any community, is engineering and designing with the intent of making that community home to many for generations to come. Pendleton is no different, and we believe our joint displays share the history and growth of the Town in a beautiful way.

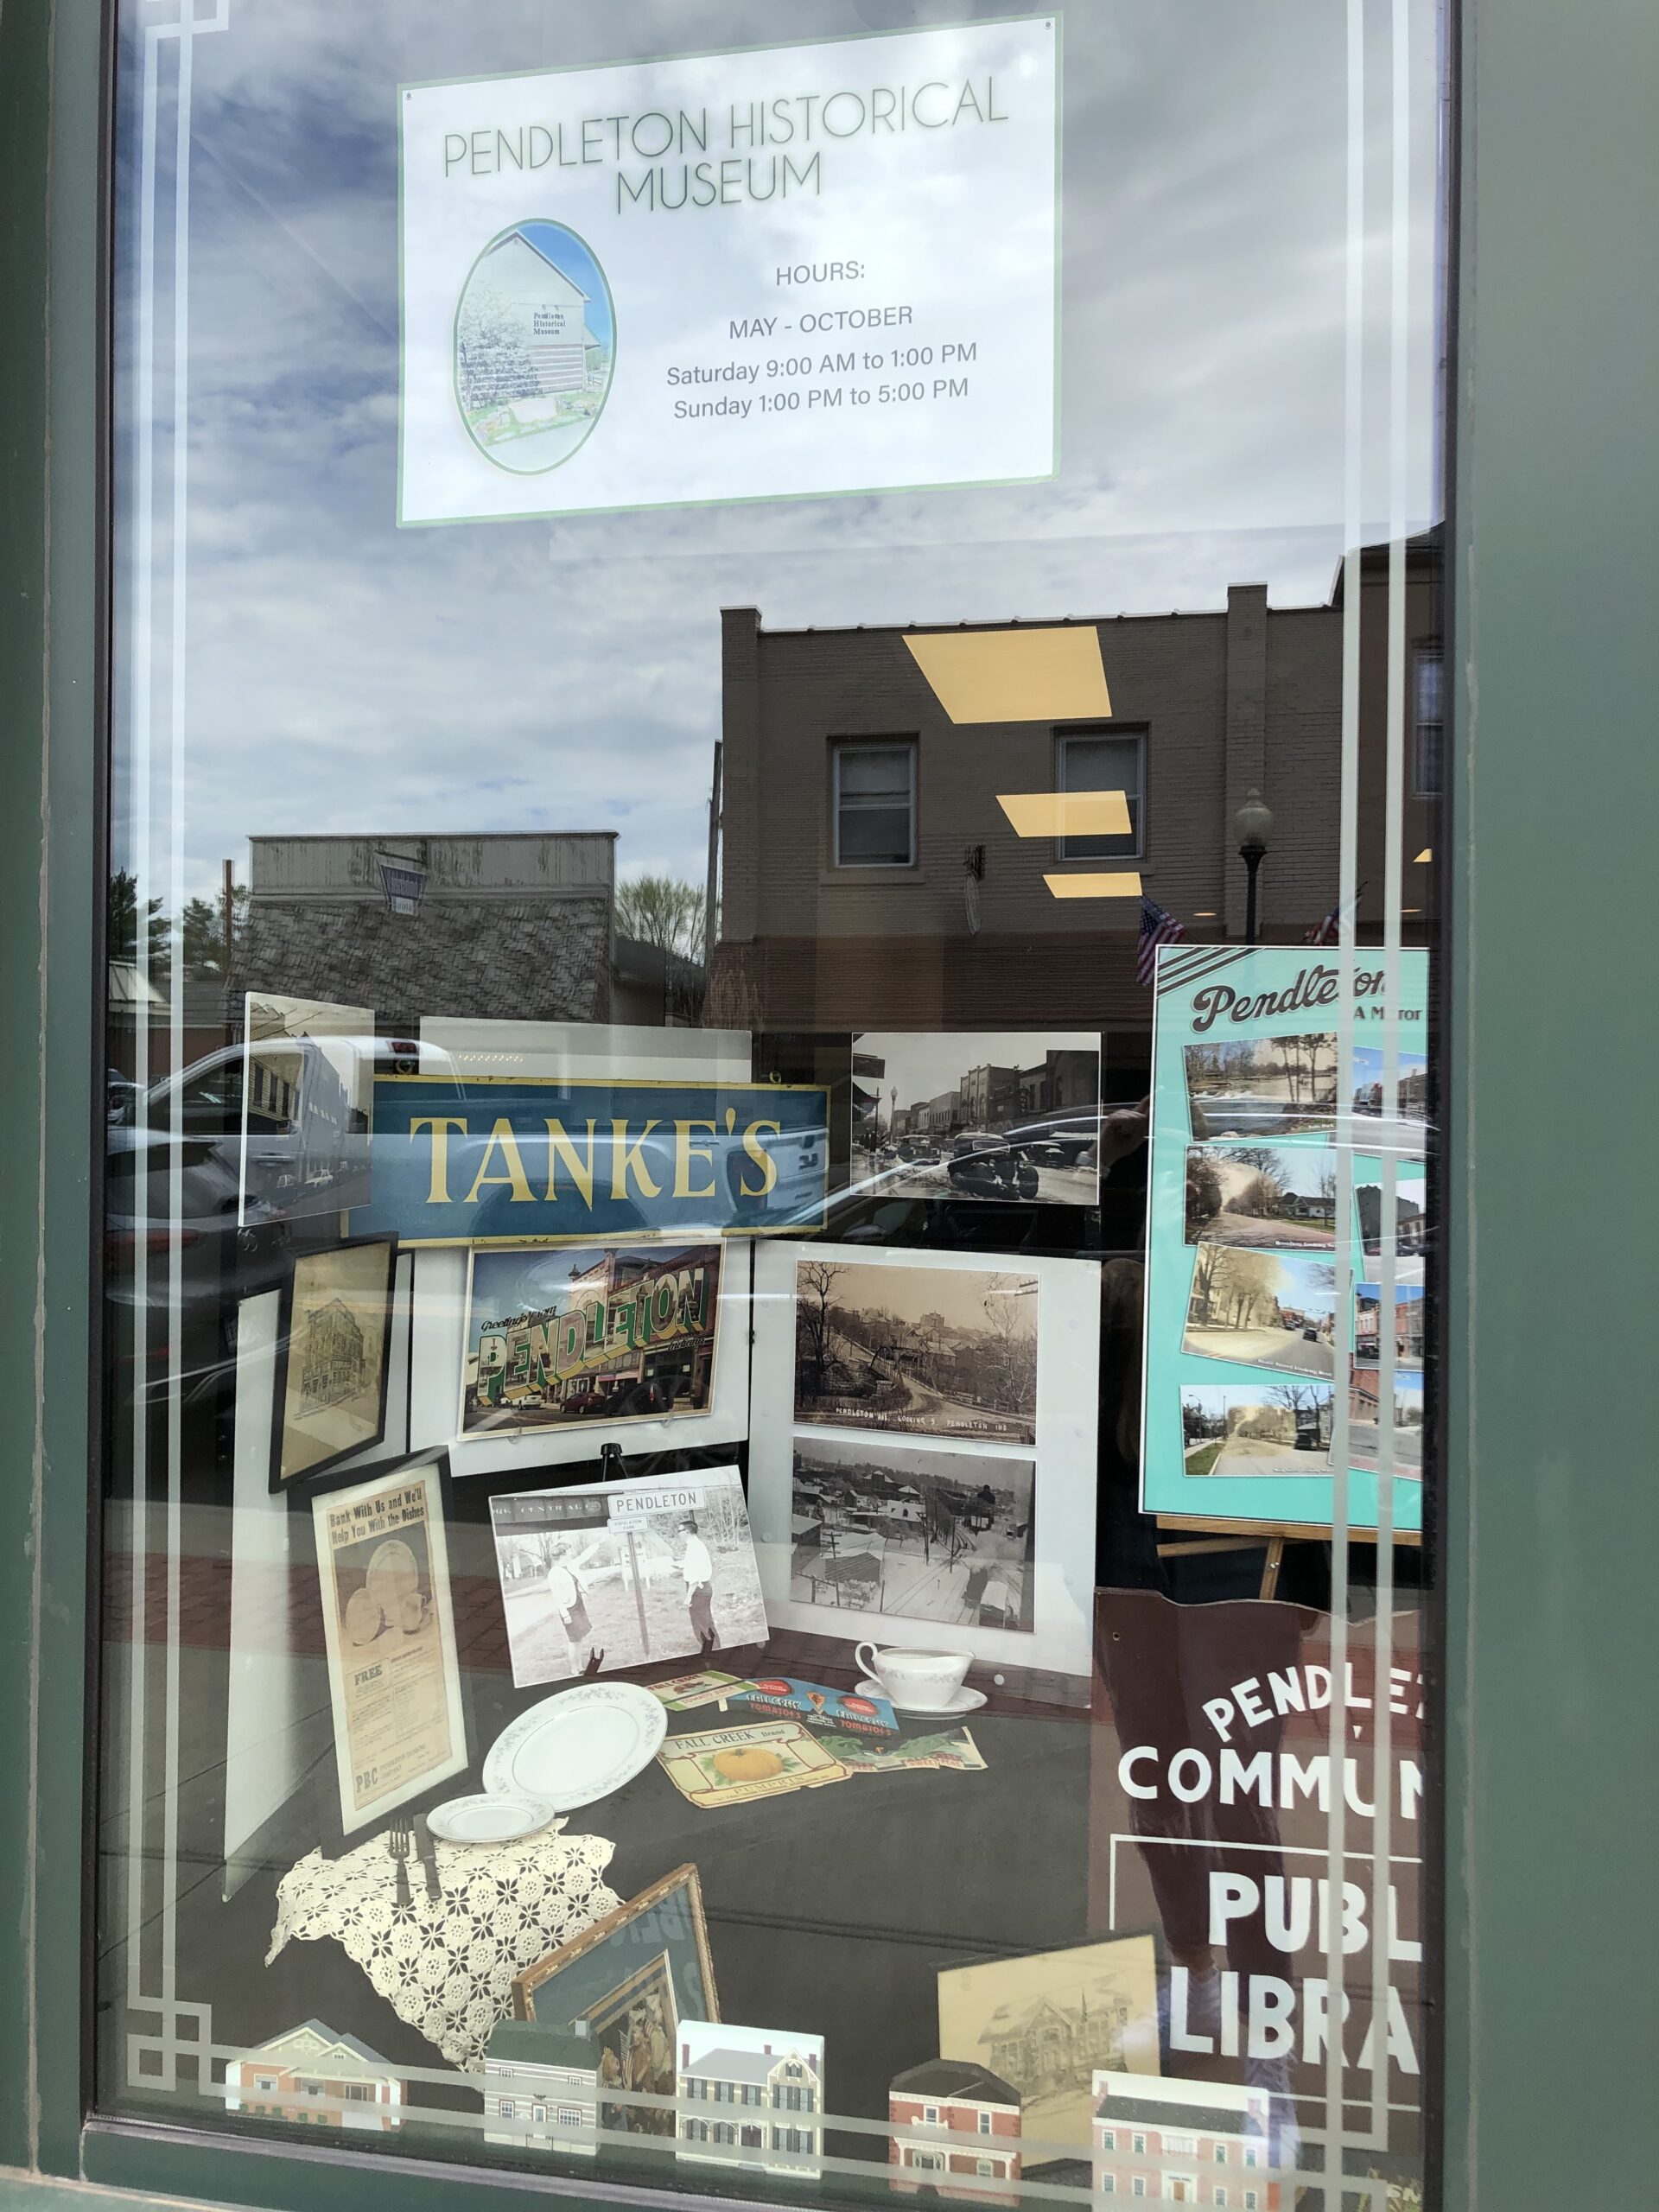
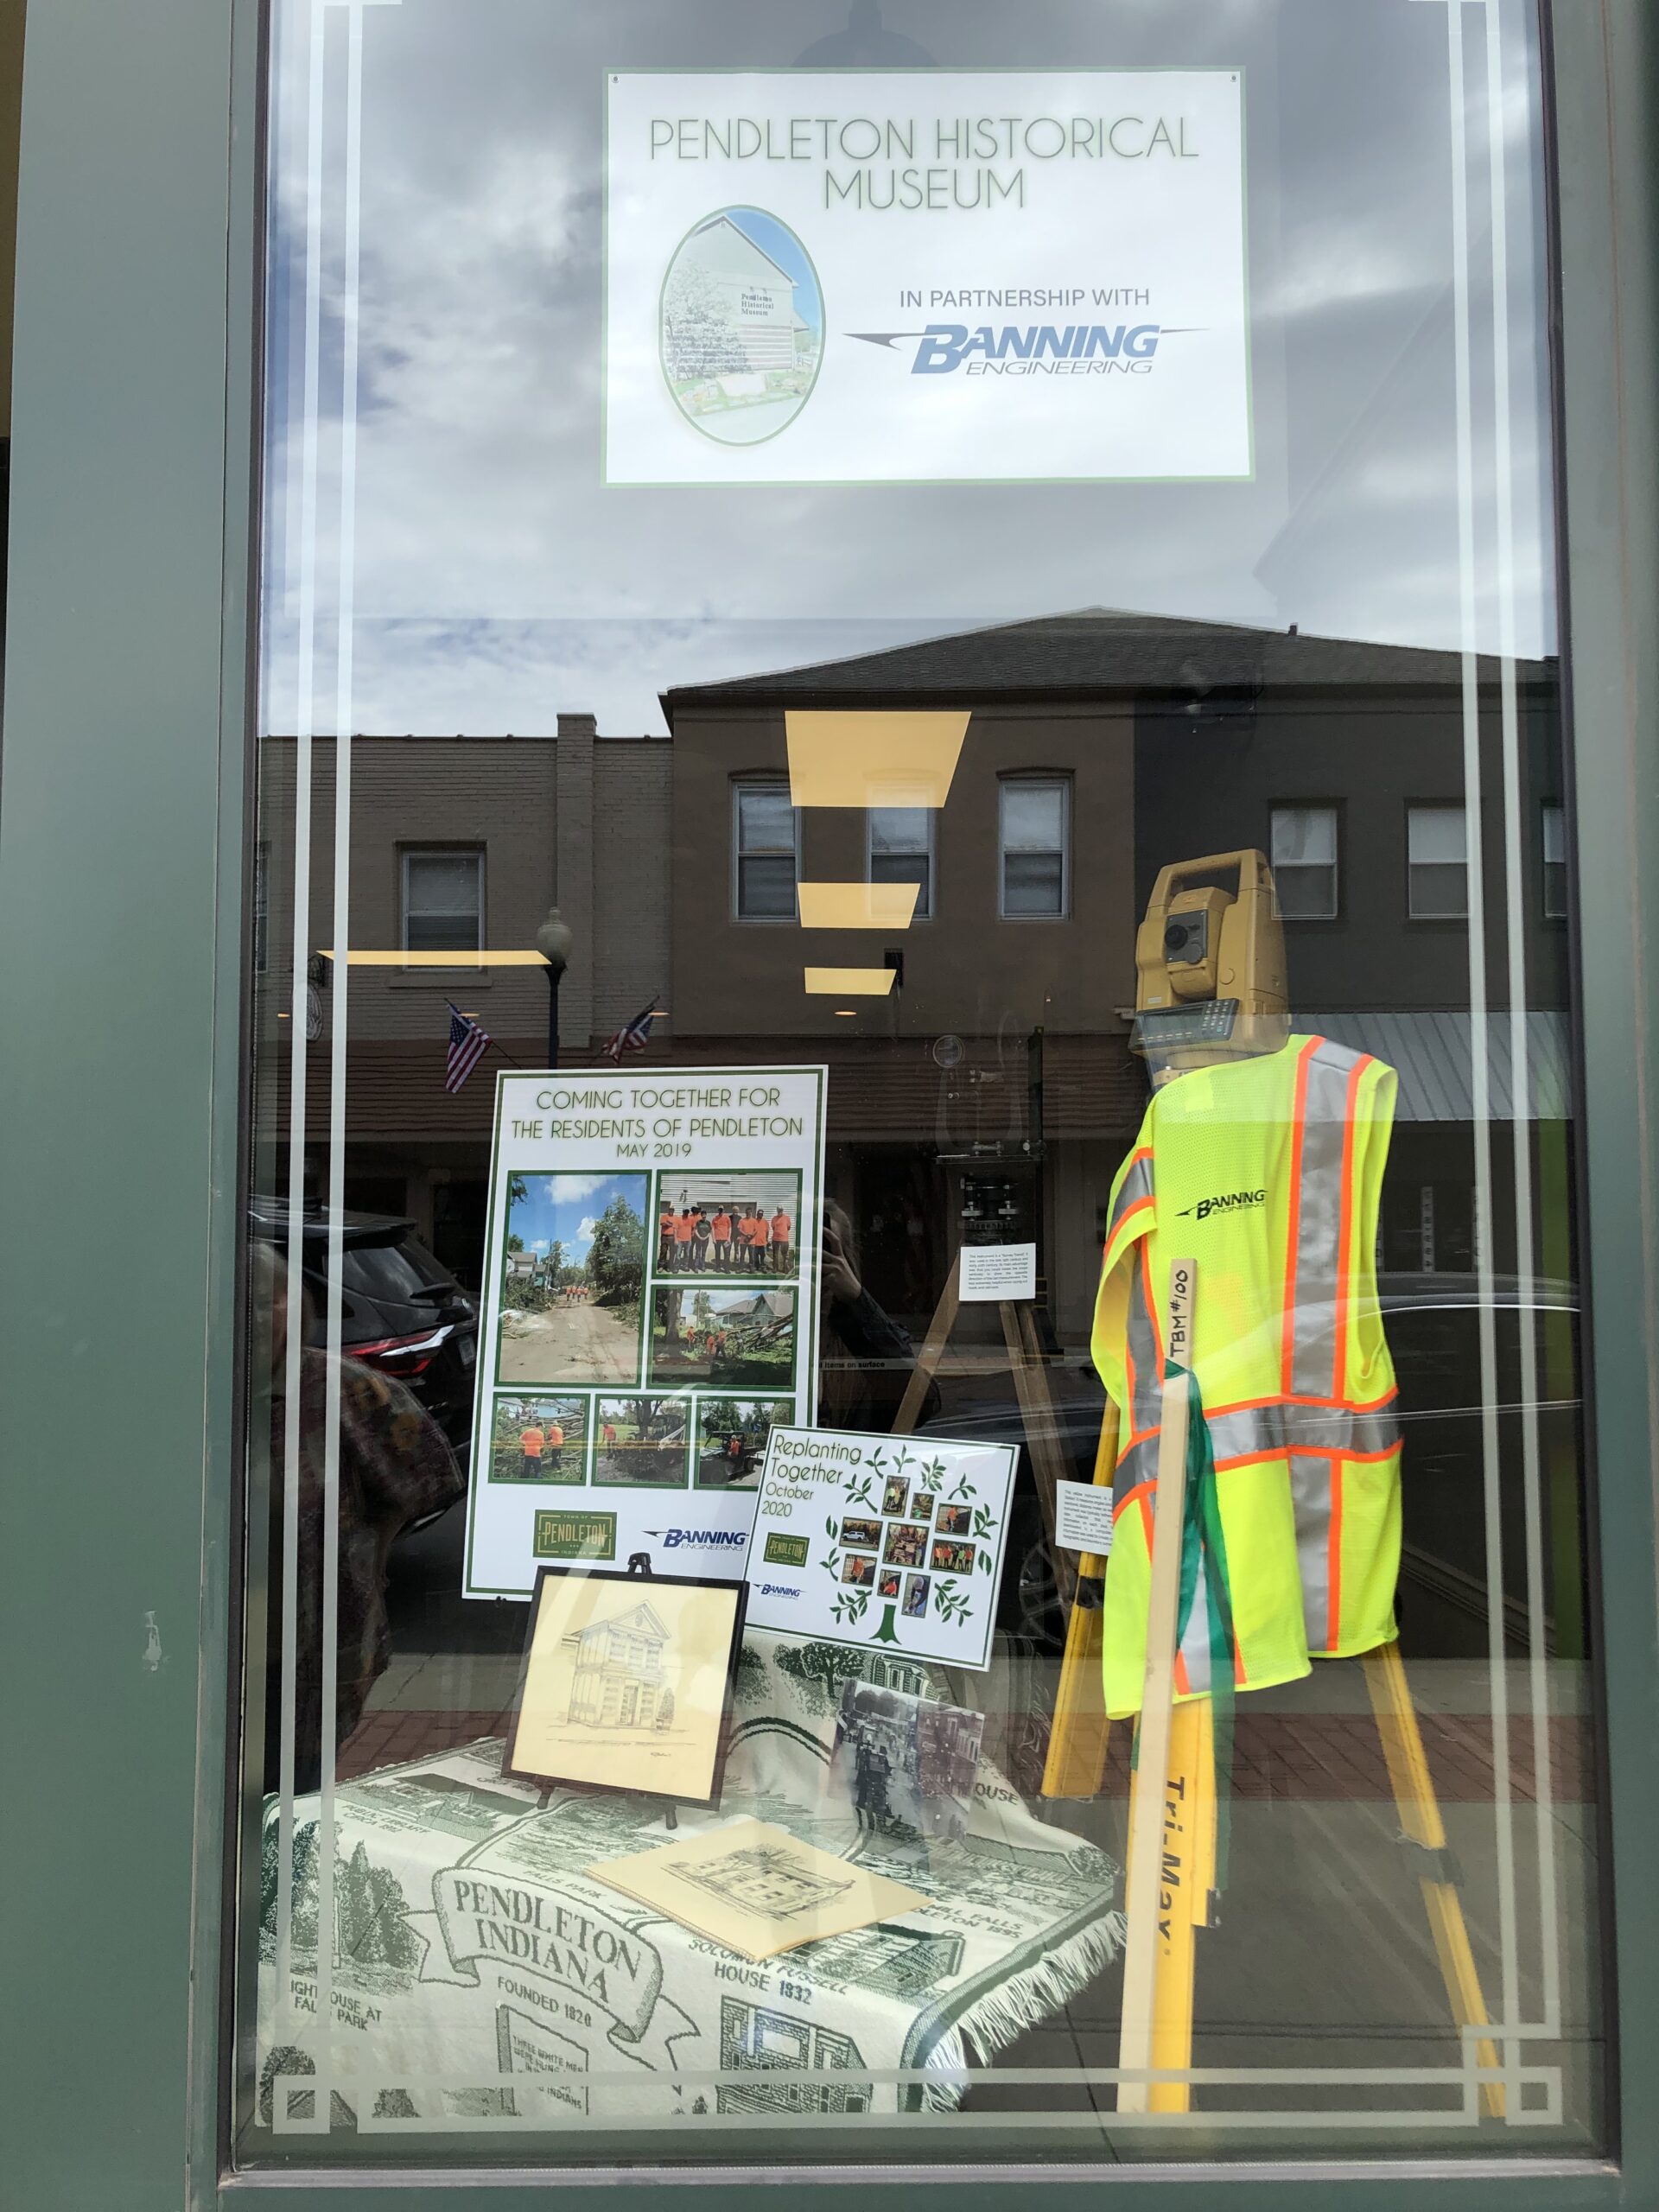
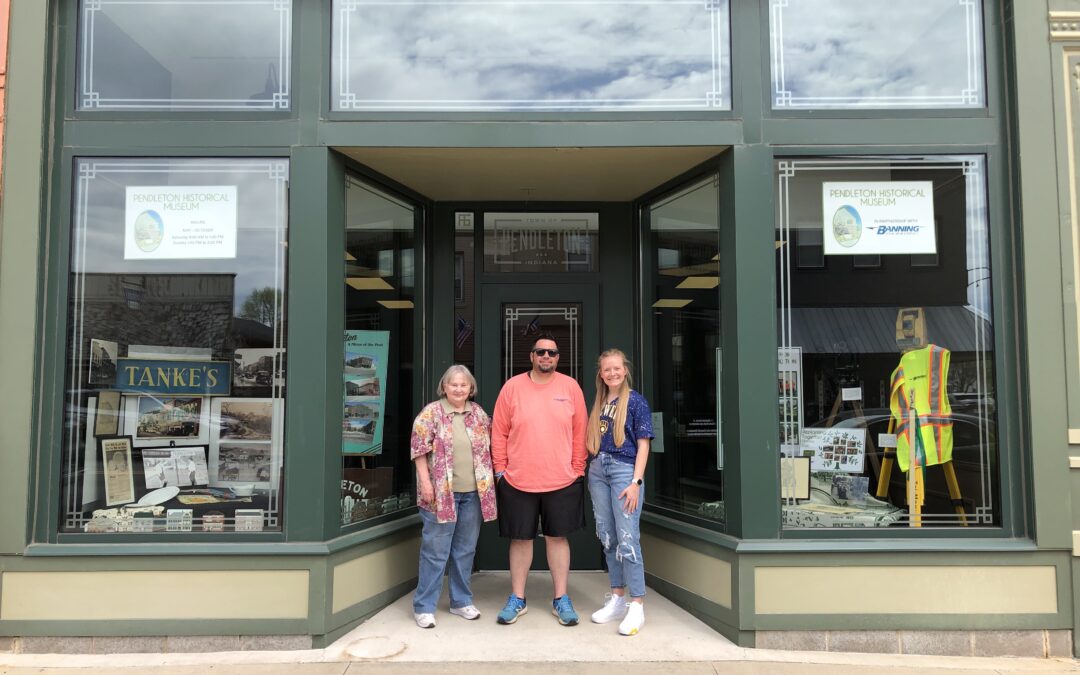
Overall, the partnership was a great success, and we are thankful for the Historical Museum and their willingness to work with us. In preparation for the display, we had a great time walking through the Museum and finding items to tie in with our more recent projects while also using some of their images and items to bring to life the Town’s history. We’ve included pictures here of the three displays; below are brief explanations of what each showcase included.

It was a treat for our team to be engaged in a project like this. If you’re in the Pendleton area, stop by the Historical Museum to browse their collection. The Museum is open May through October on Saturdays from 9:00 AM to 1:00 PM and Sundays from 1:00 PM to 5:00 PM. You won’t be disappointed by the Town’s incredible history, and we’re confident you’ll learn something new about Pendleton–we sure did! 

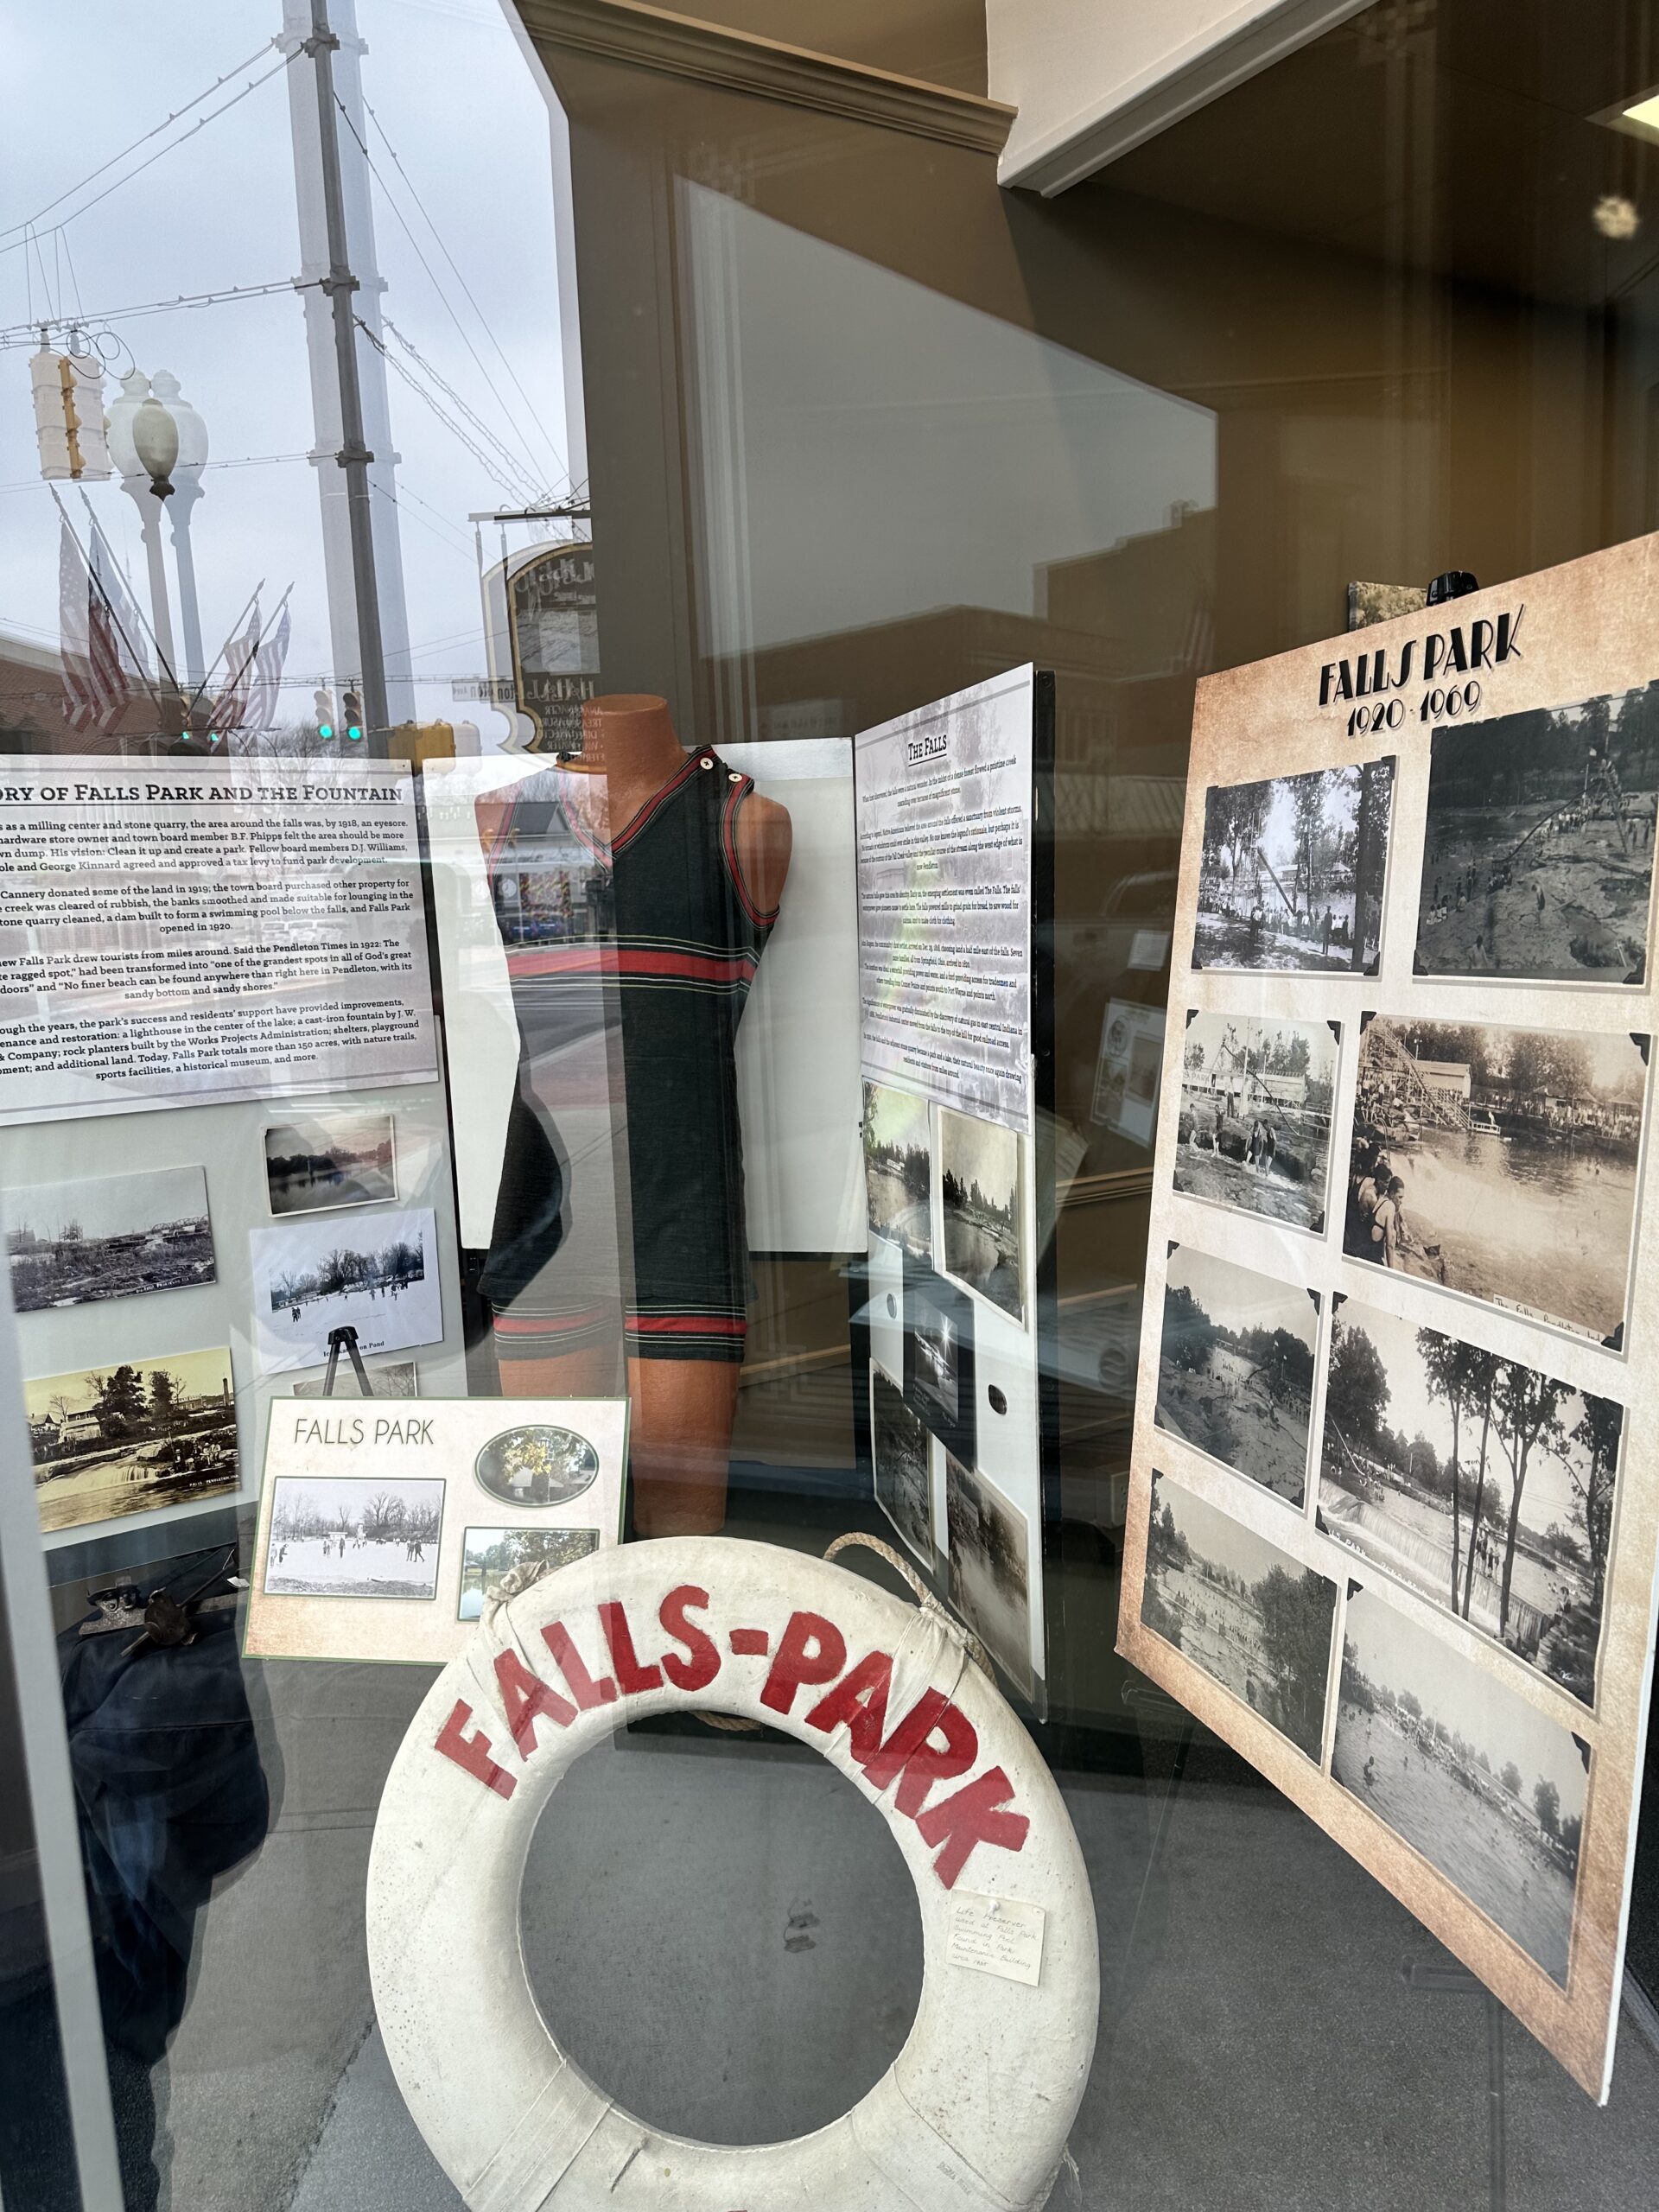
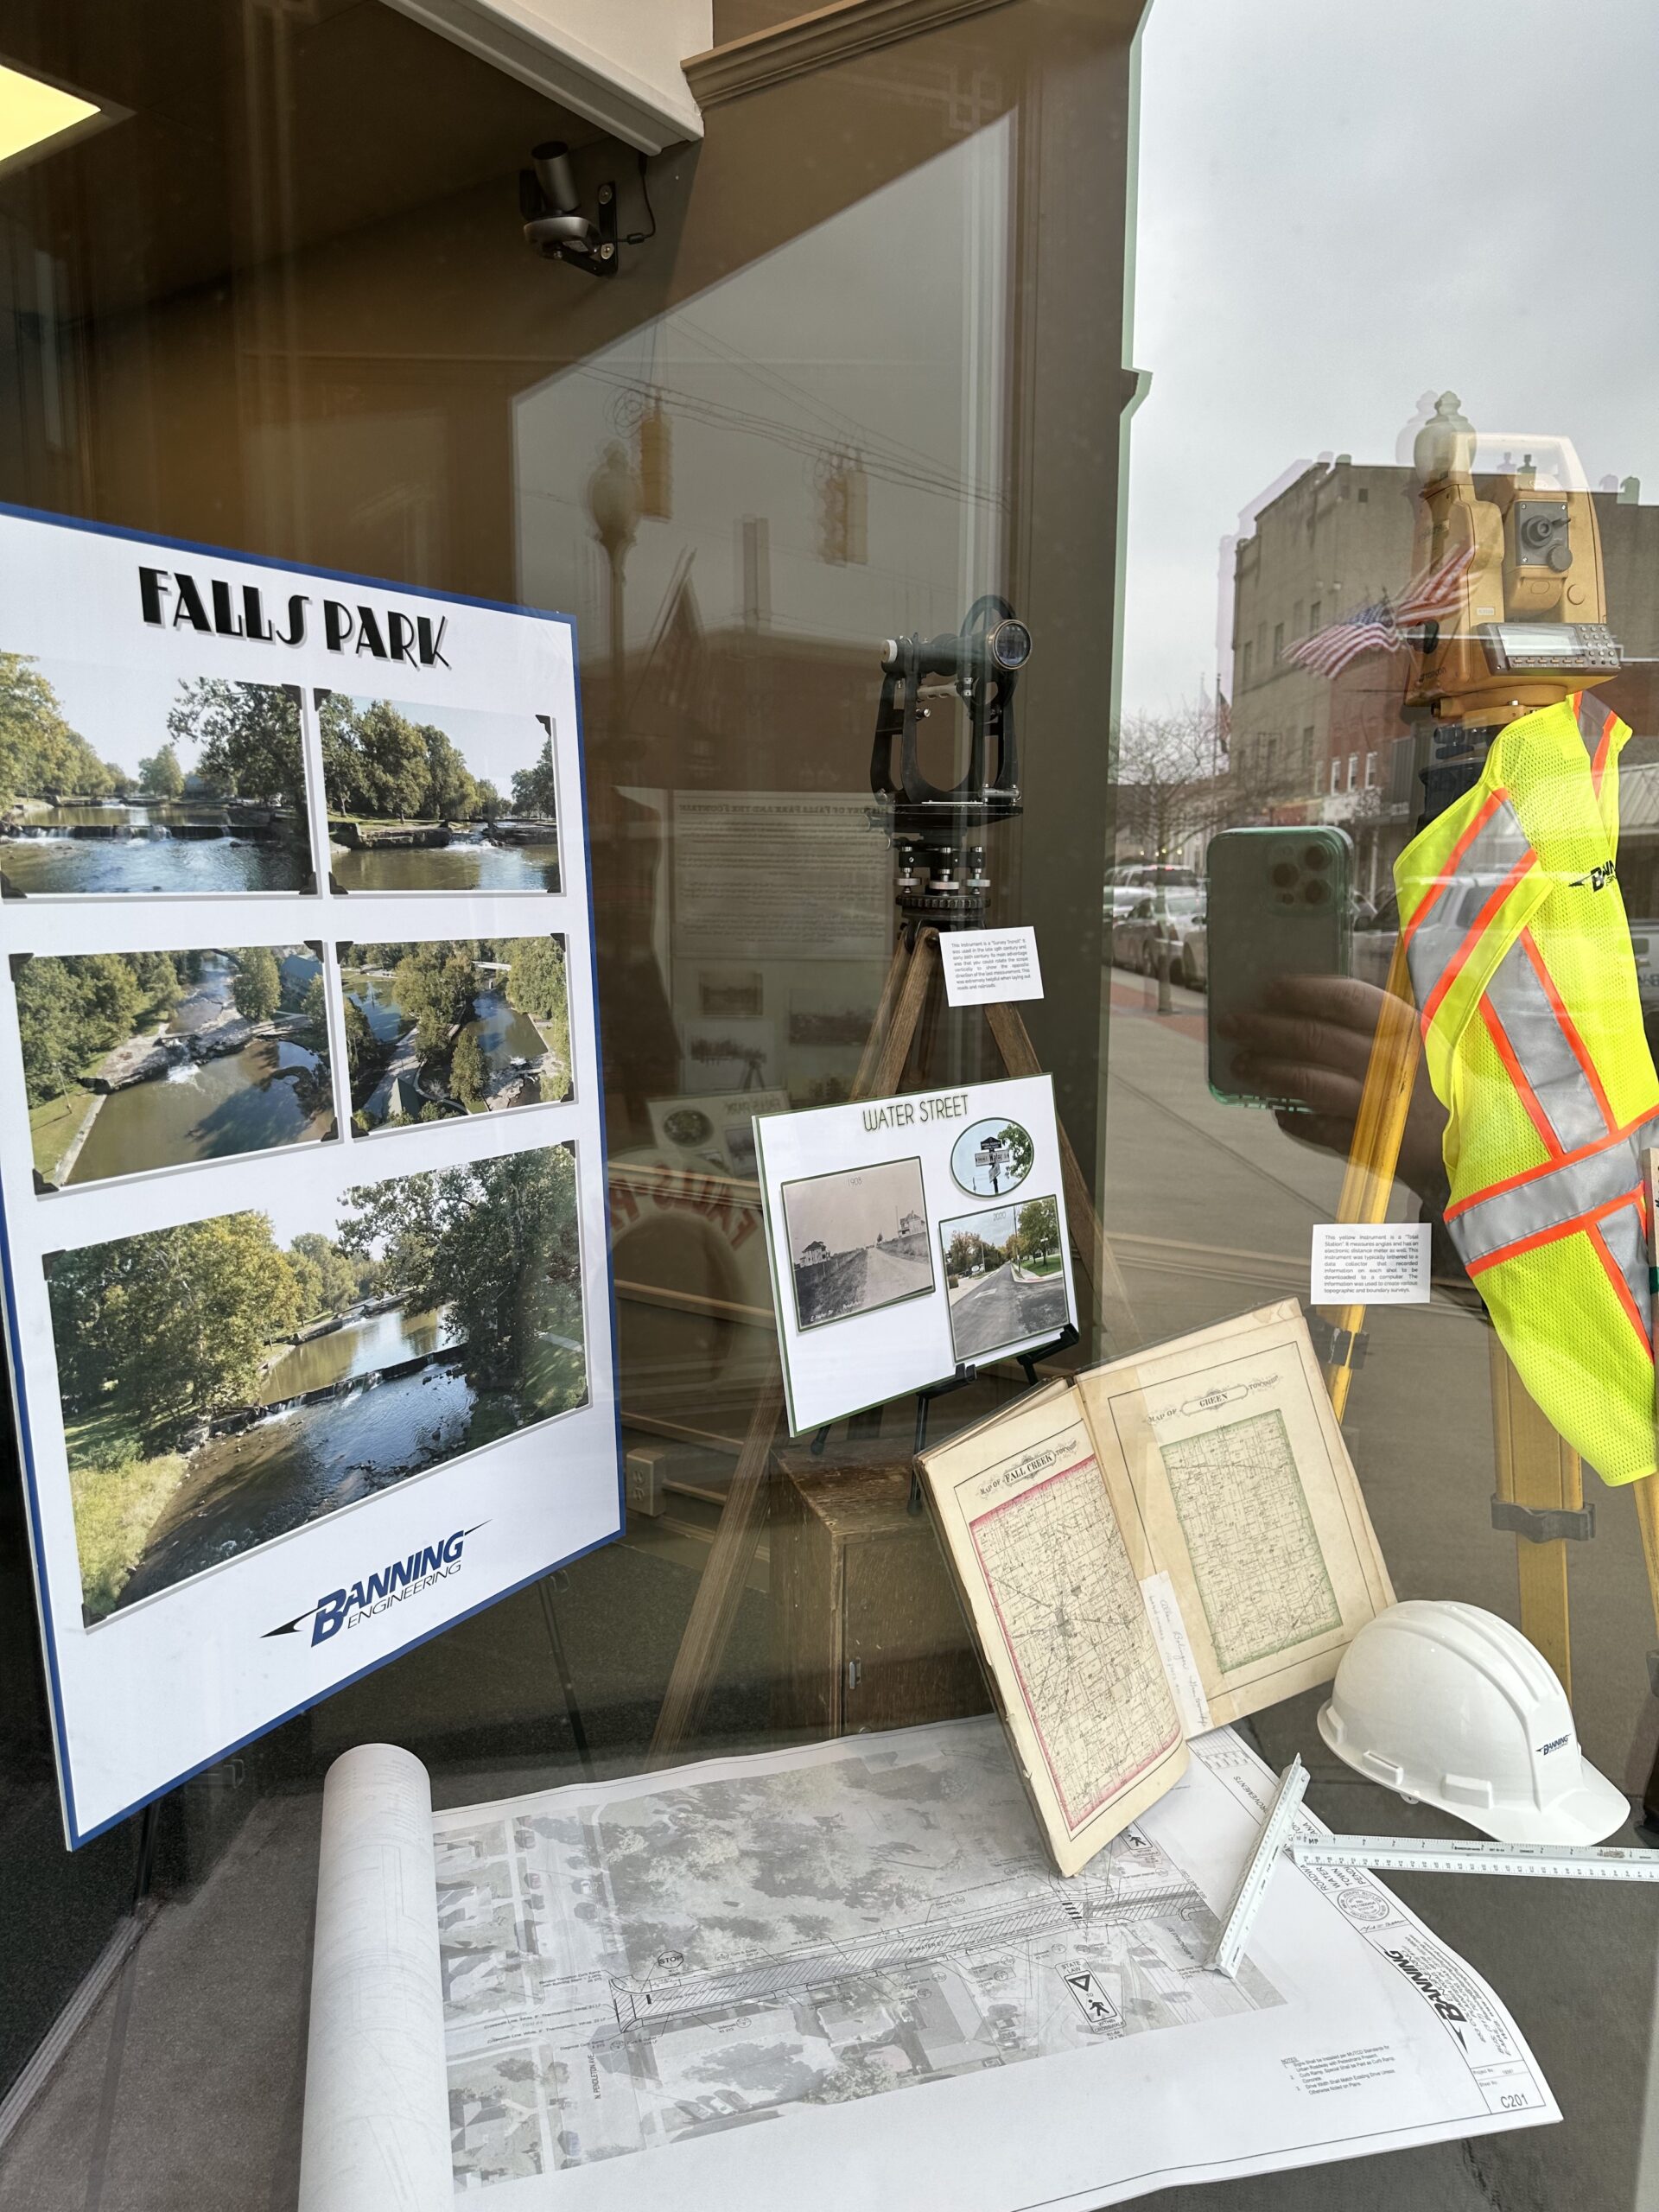
Display #1 (February 2023) featured historic and recent photos of Falls Park. We also showed historic and current images of Water Street and the road design plans.

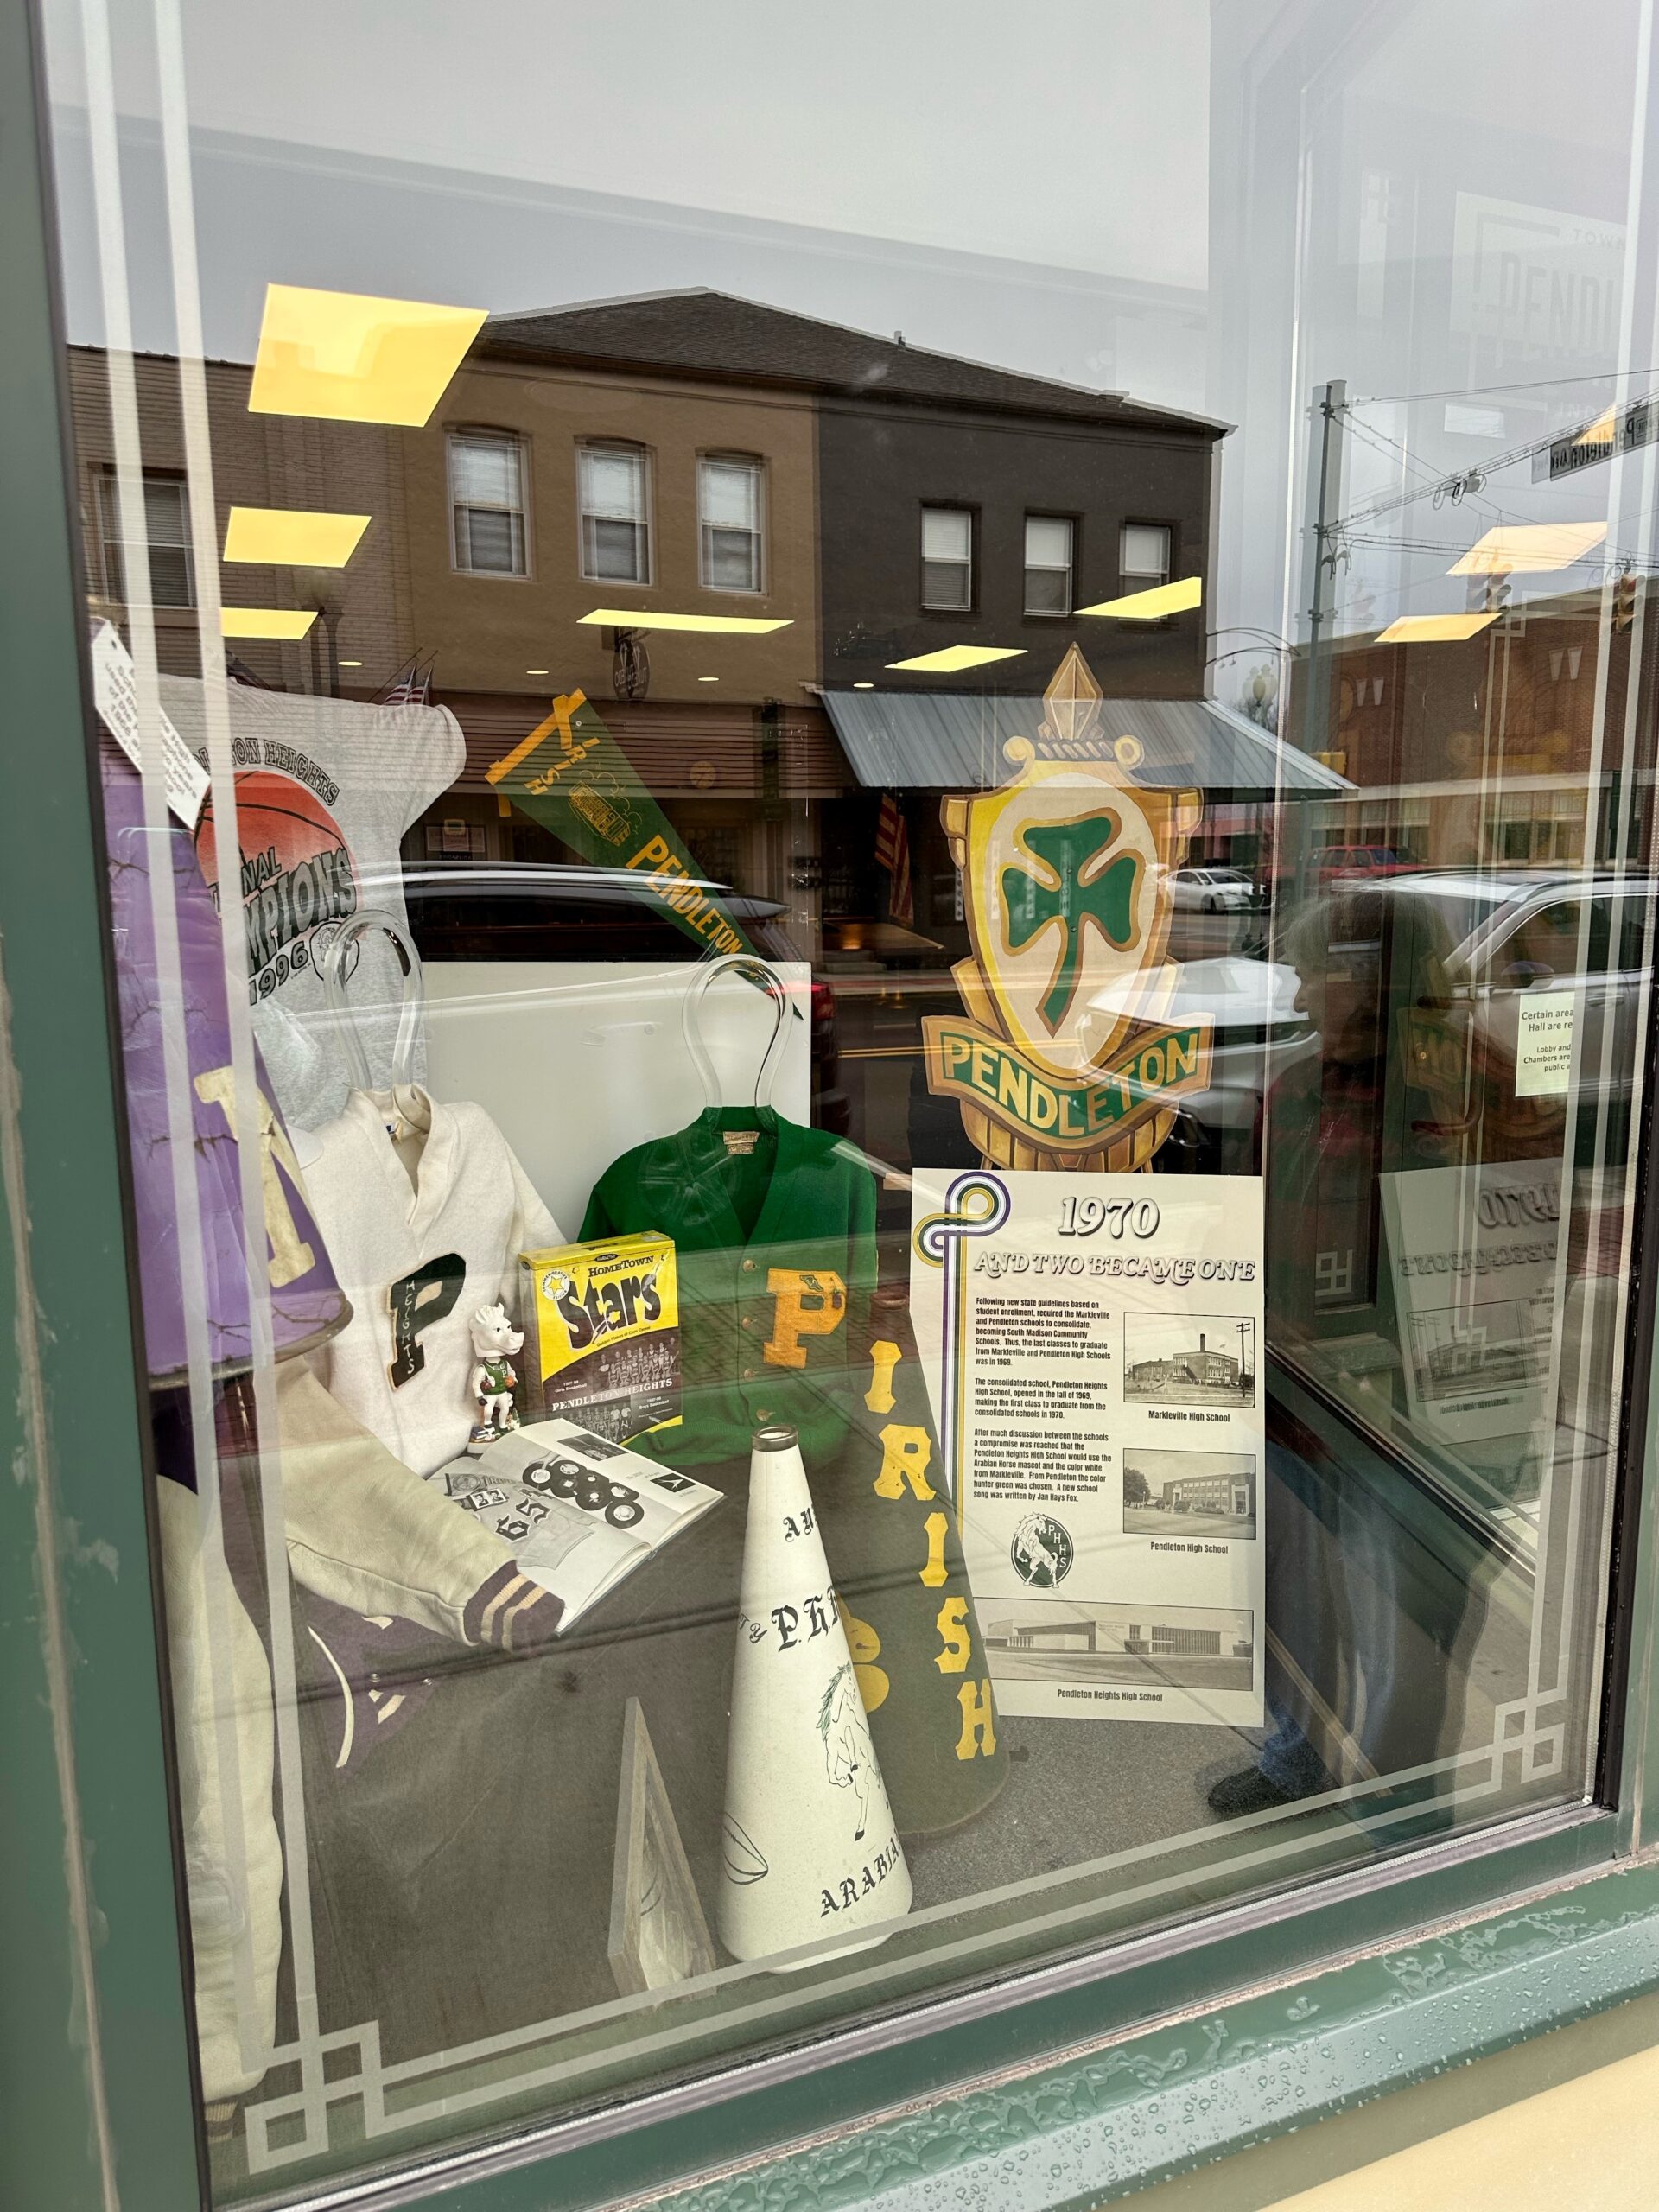
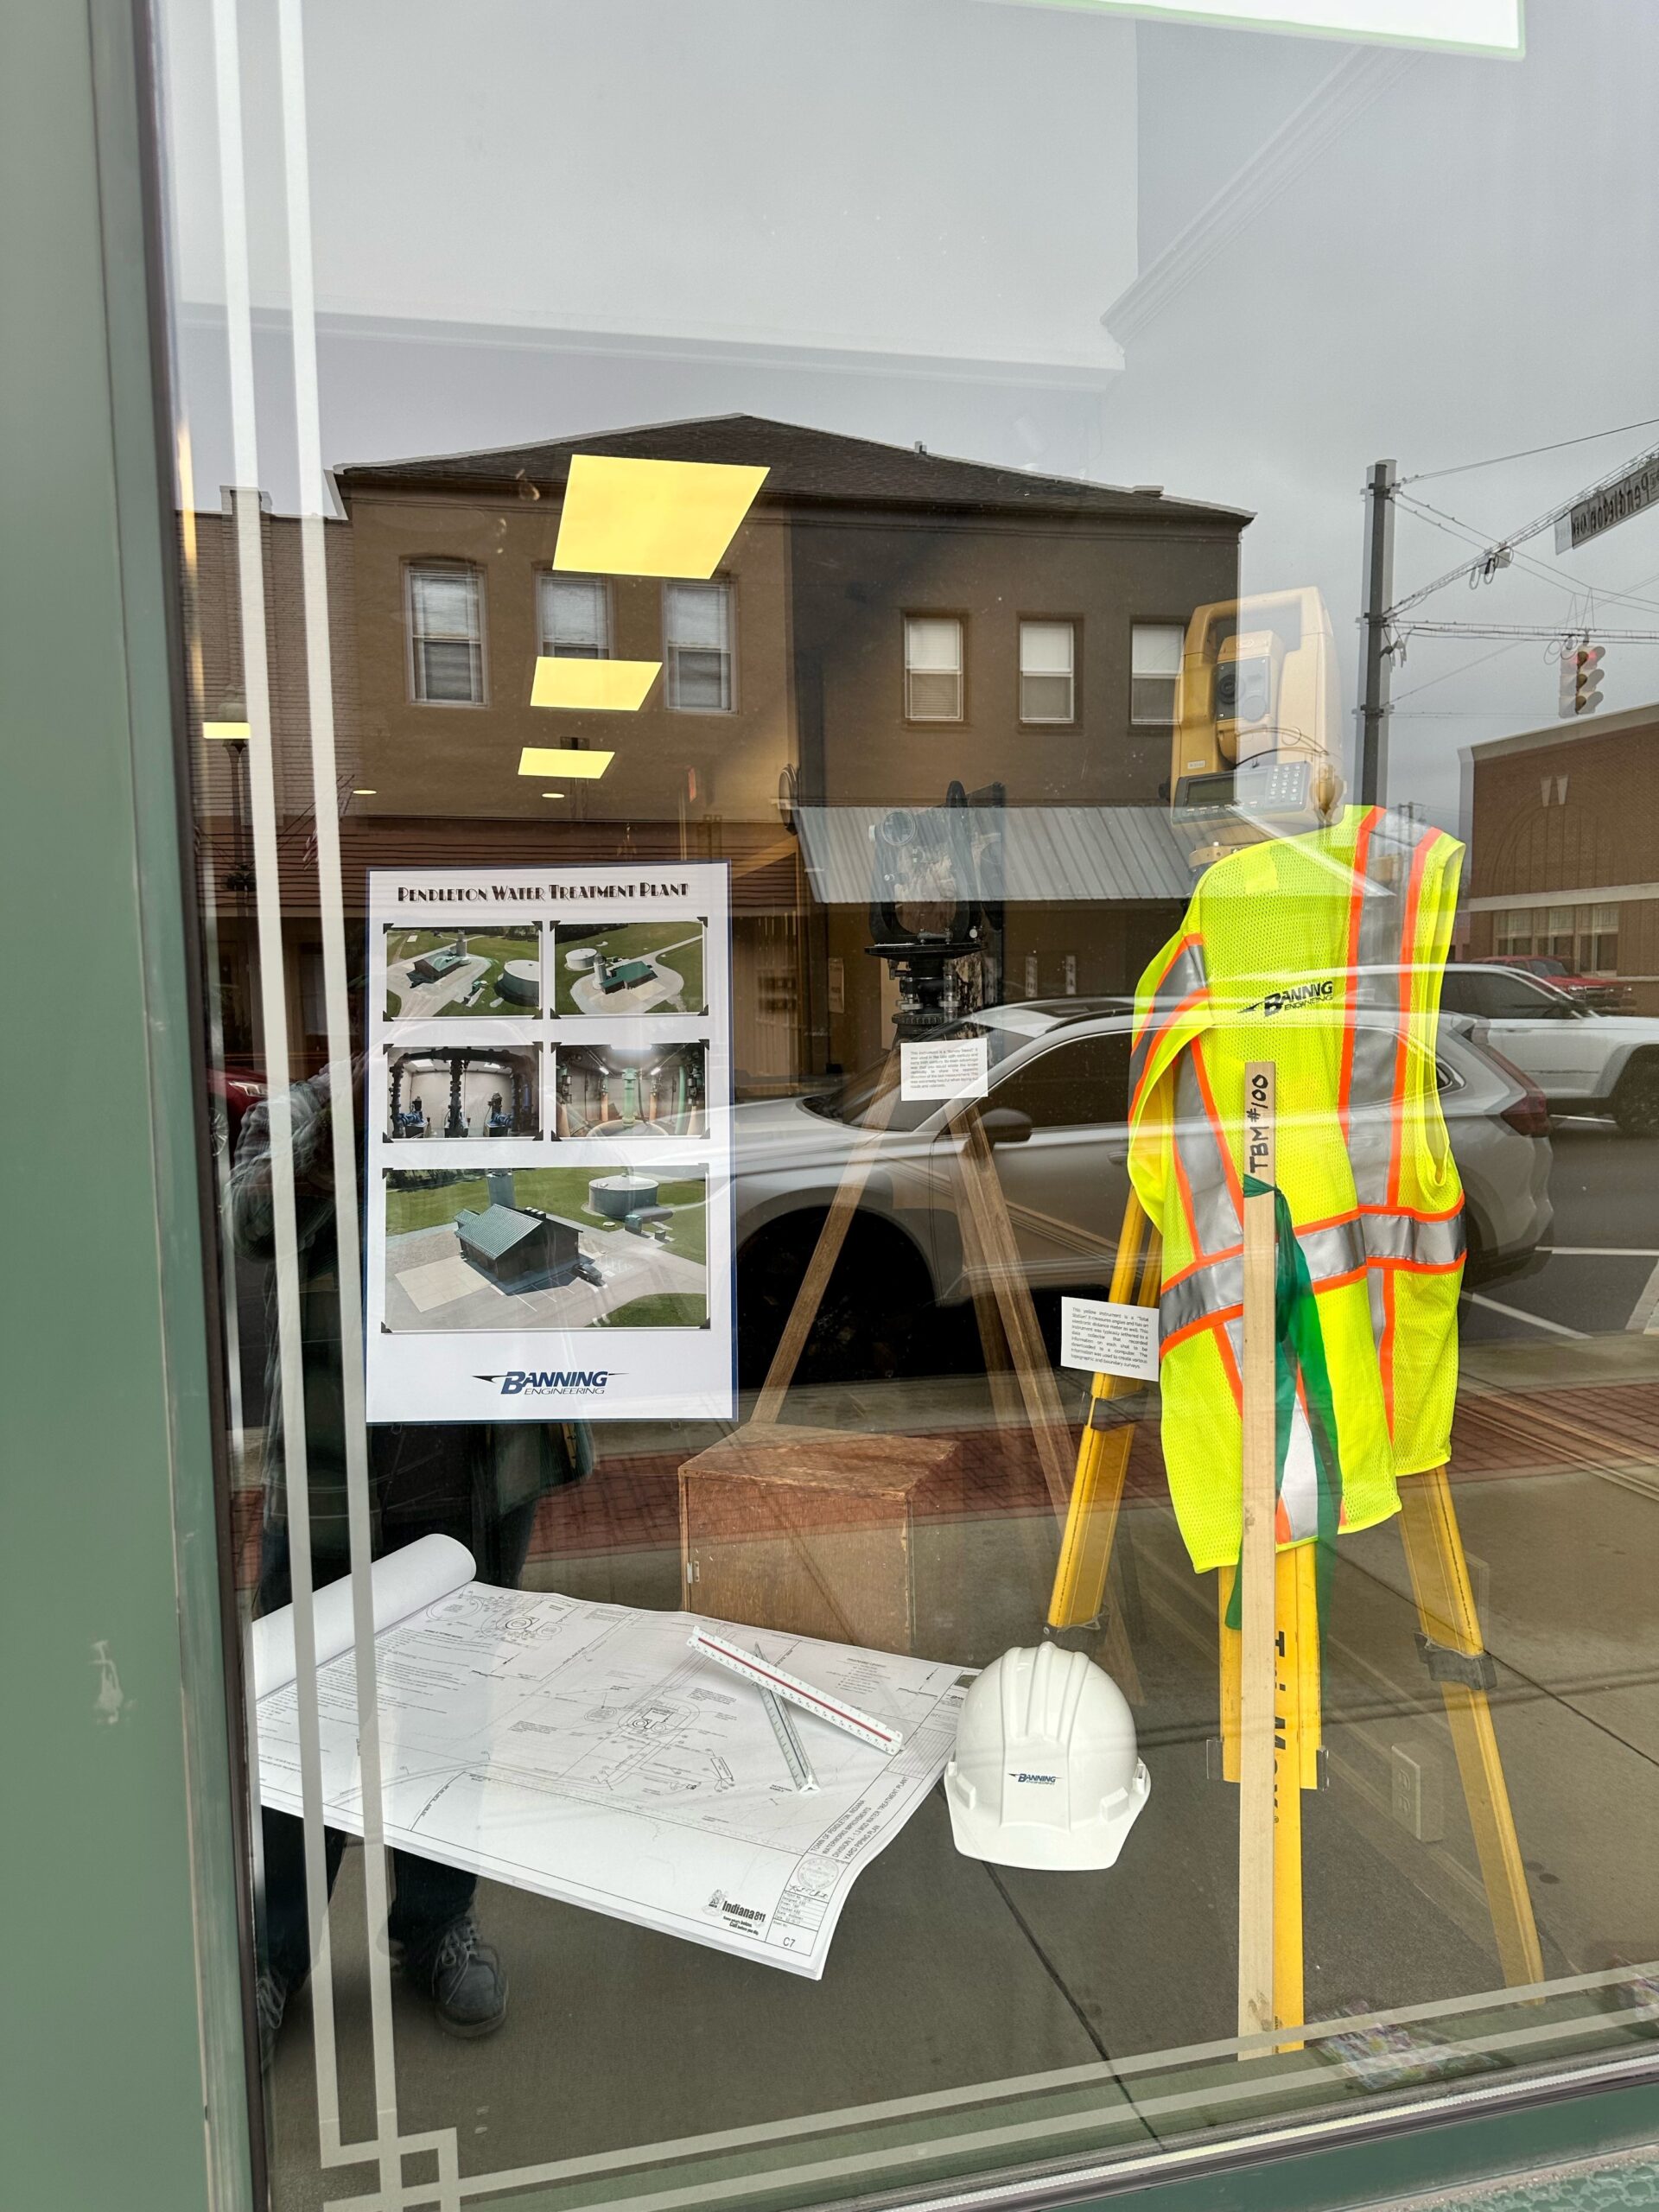
For Display #2 (March 2023), the Historical Museum featured the Town’s school history, while our window showed drone footage of the Town water plant and the plant design plans.

In the Museum’s window, Display #3 (April 2023) showcased historical shots in Pendleton blended with updated images from 2023. The Banning Engineering window featured the community engagement (Tornado Cleanup and Tree Planting) we’ve participated in throughout the time we’ve worked with the Town. 

Categories

  • Civic Engagement
  • Economic Development
  • Featured
  • From the Desk of
  • GIS Services
  • Newsletter
  • Private Utility Locating
  • Residential Site Development
  • Survey
  • Transportation
  • Wandering Indiana
  • Water & Wastewater

Recent Posts

  • Wandering Indiana ~ State Capitol, Hendricks Live, & More…
  • ESRI Features Banning Engineering in Transformative GIS Project
  • Jon Polson Accepts ISPLS Board Member Position

BANNING ENGINEERING INC.

853 COLUMBIA ROAD
SUITE 101
PLAINFIELD, IN 46168

PENDLETON OFFICE

200 S PENDLETON AVENUE
SUITE 208
PENDLETON, IN 46064

REACH US

info@banning-eng.com

(317) 707-3700

  • Facebook
  • RSS
Designed and Maintained by C2IT Consulting, Inc.
GIS Mapping for Easement Management

[vc_row][vc_column width=”2/3″][vc_column_text]Wouldn’t it be nice to quickly verify if your utility is within a recorded easement?  Banning offers a powerful solution for utilities and municipalities to manage their utility easements.  We leverage our land surveying staff to create an interactive web-based map showing all the easements across the utility territory.  The user can click on each easement to see details like instrument number, area, and even a picture of the recorded document.  This map can be made available to field personnel through Esri mobile applications for android and iOS devices.

[/vc_column_text][/vc_column][vc_column width=”1/3″][vc_single_image image=”327″ img_size=”full” alignment=”center” onclick=”img_link_large” img_link_target=”_blank”][/vc_column][/vc_row]

GIS for Marketing and Public Awareness

[vc_row][vc_column width=”3/4″][vc_column_text]Banning is in the business of helping clients meet their utility, facility, and economic development needs.  GIS plays a strong role in solving problems internal to the organization.  This same data can often be leveraged to promote, educate, and engage the public.  Banning provides services to host web-based maps, story maps, and even customized mobile apps for a variety of case uses.[/vc_column_text][/vc_column][vc_column width=”1/4″][vc_single_image image=”427″ img_size=”full” alignment=”center”][/vc_column][/vc_row]

GIS Support and Hosting Services

[vc_row][vc_column width=”2/3″][vc_column_text]At Banning, we are committed to developing a solution that works best for your organization.  Are you looking for a way to leverage your staff to collect utility data?  Banning provides services to set up your map templates, guide you on hardware, train your staff for efficient and accurate collection, and provide GIS support and hosting.  This approach is most effective in creating excellent maps even when budgets are limited.[/vc_column_text][/vc_column][vc_column width=”1/3″][vc_single_image image=”417″ img_size=”full” alignment=”center” onclick=”img_link_large” img_link_target=”_blank”][/vc_column][/vc_row]

Utility Asset Management

[vc_row][vc_column width=”2/3″][vc_column_text]Having an accurate system map empowers the utility manager to make data-driven decisions.  With data like pipe age, material, and size a water utility manager can start planning a pipe replacement program.  This approach is common but does not tell the whole story.  Banning engineers can use the GIS system data to quickly create a hydraulic model.  The hydraulic model is a powerful tool to show current system deficiencies as well as performance under future development flows.  This data allows the manager to make pinpoint improvements for the largest system benefit.  The resulting data, mapped in the GIS system, is a powerful visual to graphically show the short and long-term capital improvement plan for your utility.[/vc_column_text][/vc_column][vc_column width=”1/3″][vc_single_image image=”324″ img_size=”full” alignment=”center” onclick=”img_link_large” img_link_target=”_blank”][/vc_column][/vc_row]

GIS Mapping for Utilities

[vc_row][vc_column width=”2/3″][vc_column_text]Have you ever had a late-night main break, but can’t find the shut-off valves?  Is your senior operator about to move on or retire?  Afraid his 30 years of system knowledge will go with him?  These are two common examples of problems utility managers face.  The solution has never been easier or more affordable.  Mobile GIS mapping technology can revolutionize the way you run your utility.  Banning offers map setup, training, GIS support and hosting services for a wide variety of utilities including Water, Wastewater, Storm, Gas and Electric.  Using the latest in cloud-based Esri® Collector mapping technology, let Banning show you how we can:

  • Map your system to the accuracy that’s appropriate for your system and budget
  • Print reports for permitting agencies
  • Link features like valves, power poles and manholes to photos, as-builts, and videos
  • Securely host your map online for mobile device access
  • Leverage viewing and collection apps for use on android and iOS devices
  • Setup inspection layers for routine maintenance tracking
  • Train your staff on collecting and managing the data
  • Prepare your system for SRF funding eligibility
  • Prepare GIS Standards for contractors so the financial burden of map additions is put on developers

[/vc_column_text][/vc_column][vc_column width=”1/3″][vc_single_image image=”323″ img_size=”full” alignment=”center” onclick=”img_link_large” img_link_target=”_blank”][/vc_column][/vc_row]

GIS Maps for Parks

[vc_row][vc_column width=”2/3″][vc_column_text]Facility managers can bring the park inventory struggle to an end by creating an interactive park inventory map.  Feature like benches, playground equipment, or trash receptacles can be located, assessed for condition and photographed.  Adding a layer for an ADA accessibility assessment or for planning a long-term park improvement schedule can be very powerful.  These internal management tools can also be adapted to provide park information outside your organization to the community.  Story maps are a powerful way to educate and encourage park use.      [/vc_column_text][/vc_column][vc_column width=”1/3″][vc_single_image image=”325″ img_size=”full” alignment=”center” onclick=”img_link_large” img_link_target=”_blank”][/vc_column][/vc_row]

PASER Road Rating Maps

[vc_row][vc_column width=”2/3″][vc_column_text]Are you ready to get serious about managing your street network? Since 2016, the Community Crossings Matching Grant through INDOT has required an asset management plan.  Banning can create an interactive map of your street network with each segment color coded by PASER Pavement rating.  More powerful yet, showing multiple years of PASER data can show deterioration trends.  With this data, you can create a long-term capital improvement plan with a powerful visual to show the public and elected officials.[/vc_column_text][/vc_column][vc_column width=”1/3″][vc_single_image image=”326″ img_size=”full” alignment=”center” onclick=”img_link_large” img_link_target=”_blank”][/vc_column][/vc_row]

GIS Planning for Economic Development

[vc_row][vc_column][vc_column_text]Are you looking to give your community a competitive edge?  Draw attention from site selectors with the latest in interactive web maps, drone fly-over videos and 3D renderings for your developing community.   Banning can help create a web-based experience to highlight key features developers are looking for like available utilities, proximity to transportation routes, and topography of the site.[/vc_column_text][/vc_column][/vc_row]