
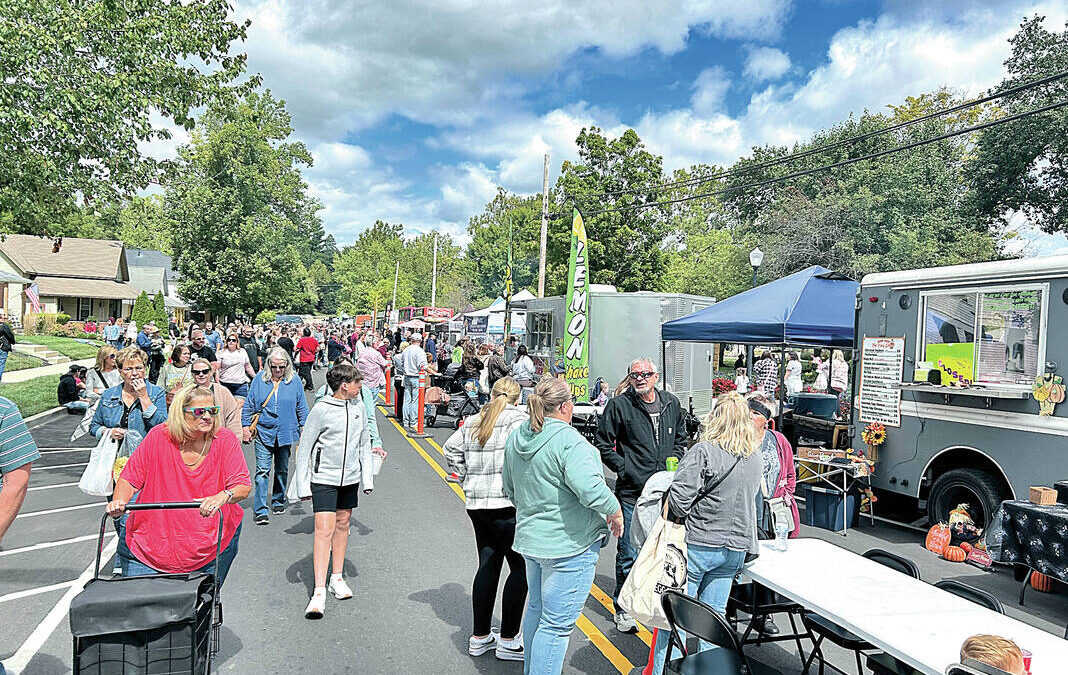
Most of the time when we talk about GIS at Banning, we’re talking about utilities, infrastructure, parcels, asset inventories, or one of the many other ways we use GIS for our clients. But sometimes GIS gets to be used for something a little different.
Over the past several months, I’ve had the opportunity to use GIS to create a few different public-facing resources for Pendleton. It started with an interactive flood resource for the Town of Pendleton and has since expanded into interactive maps for three community events: the Pendleton Fall Festival, Pendleton Porch Music Festival, and Christmas in Pendleton.
They’re all pretty different projects, but the idea behind them is the same: take information people need and make it easier to find, understand, and use.
Town of Pendleton Flood Resource
The first of these projects was an interactive flood resource for the Town of Pendleton.
Flood information can be difficult to navigate when you’re looking through different maps, documents, websites, and other resources. The goal with this map was to give people an easier way to explore that information geographically and have a central resource they could use to better understand flood information around Pendleton.
It’s a good example of what GIS can do beyond simply putting features on a map. You can take information that might otherwise be difficult to find or understand and turn it into something people can interact with and explore based on the location that matters to them.

Check out the Town of Pendleton Flood Resource:
https://banning.maps.arcgis.com/apps/instant/basic/index.html?appid=3b6dfbc66ca349c590759fe6caaa4f80
Pendleton Fall Festival
From there, I got the opportunity to use GIS in a completely different way.
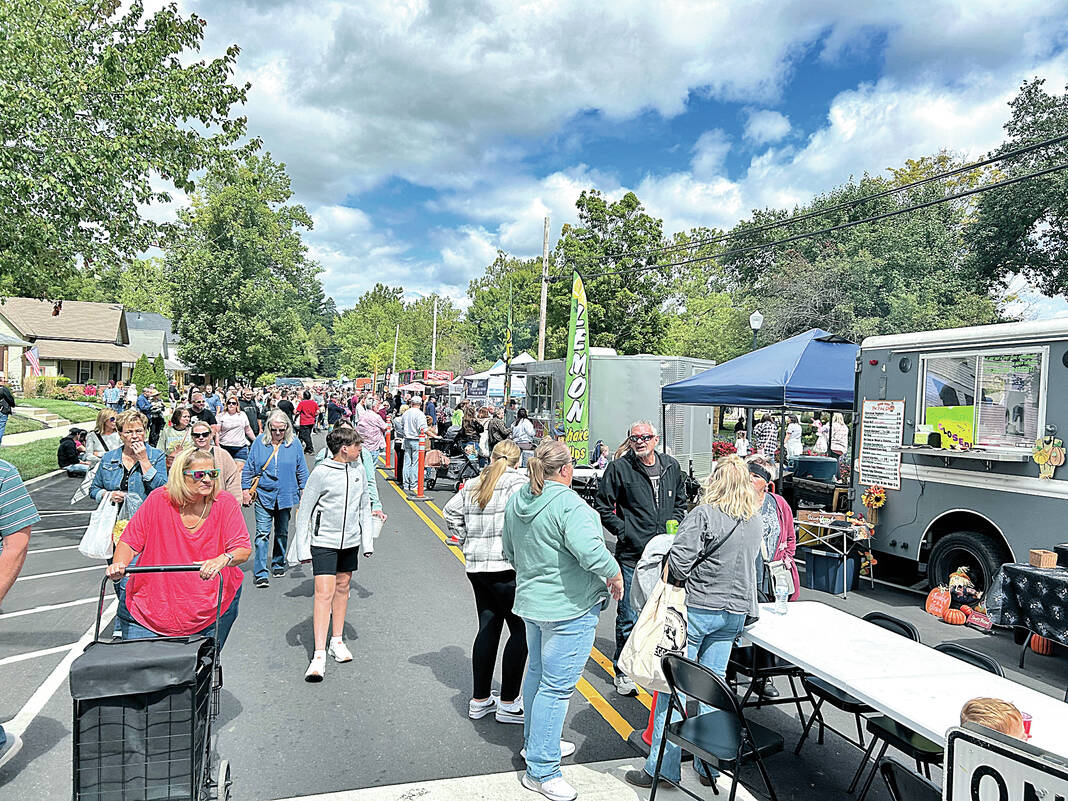
Outside of Banning, I’m involved with Main Street Pendleton, and this year I created an ArcGIS StoryMap for the Pendleton Fall Festival, which took place September 11–12.
With vendors and activities spread throughout downtown, there is a lot of information to get out to people. The StoryMap gave us one central place to bring all of that together.
Instead of someone trying to find an old Facebook post, track down a paper map, or figure out where something is located, they could pull up the StoryMap and explore the festival from their phone.
It was also nice from the planning side because we weren’t locked into a printed map. As things changed leading up to the festival, I could make updates and everyone was still using the same link and QR code.
Check out the Fall Festival StoryMap:
https://storymaps.arcgis.com/stories/60e729b0939d4ef6aea9308737d9ad5c
Pendleton Porch Music Festival – October 3
Next up is the Pendleton Porch Music Festival on Saturday, October 3, from 11:30 a.m. to 6:30 p.m.
This one has probably been my favorite to build because the event fits GIS so well.
For the festival, porches around Pendleton become stages for different musicians throughout the day. When you have multiple artists, porches, performance times, activities, sponsors, and everything else happening around town, an interactive map makes a lot more sense than trying to fit everything onto one piece of paper.
The StoryMap lets people see where the different porches are located, who’s playing, when they’re playing, and what else is happening throughout the festival.
The goal is for someone to be able to pull it up while they’re walking around town and say, “Alright, who do we want to see next and where do we need to go?”
There are also plenty of other things happening besides music, so the StoryMap gives us a place to bring those activities and other festival information together too.
Check out the Porch Music Festival StoryMap:
https://storymaps.arcgis.com/stories/a95c15cf122c443096e4518572f29cf6
Christmas in Pendleton – November 14
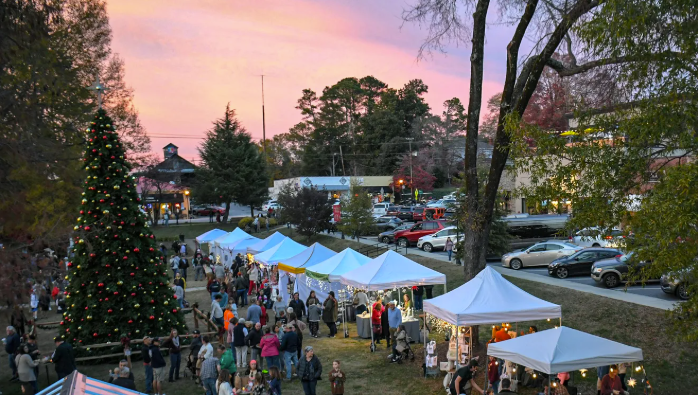
After Porch Fest, we’ll turn our attention toward Christmas in Pendleton on Saturday, November 14, from 10 a.m. to 6:30 p.m.
The Christmas StoryMap will work the same way by giving visitors one place to find the different activities, shopping, entertainment, and other things happening around Pendleton throughout the day.
Each project has also given me new ideas for the next one. There are things I’ve changed, added, or approached differently after seeing how people actually use these resources.
Check out the Christmas in Pendleton StoryMap:
https://storymaps.arcgis.com/stories/5d46fe3d7fb447df9415e75440c63644
GIS Can Be a Lot of Things
One of the things I’ve enjoyed most about these projects is getting to use GIS in ways that are a little outside of what people normally picture when they hear “GIS.”
At the end of the day, a lot of the questions we’re trying to answer are still location questions.
Where is this vendor? Where is this activity? Where can I park? Where is this band playing? What’s close to me? What does flood information look like around my property?
That’s GIS.
Being able to take some of the same skills and technology I use every day at Banning and use them to help a community I’m involved in has been really rewarding. It’s also been fun seeing people actually walking around an event with something I built pulled up on their phones.
None of these resources need to be overly complicated. They’re really about taking a lot of information and making it easier for people to find and use.
And if GIS can help someone find a water main during the week, better understand flood information around their property, and find their next favorite band on a porch over the weekend, I’d say that’s a pretty good use of it.